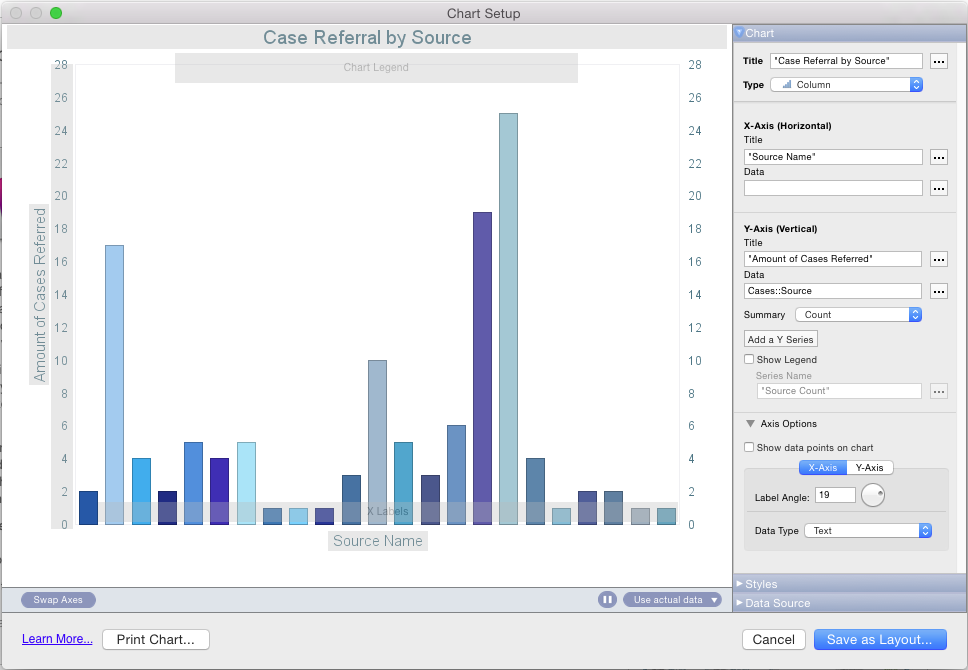
LawAlign’s charting functionality is a powerful tool which can be used to create a visual summary of your data. You can create charts on a fly by using any field within LawAlign, chart by the source, date cases are opened, SOL dates, expenses, number of invoices produced and etc. You have full control over the look and presentation of the charts you create.


